
Bitwise Chart Studio
Internal tools + systems design
A chart took twenty minutes. That was not the whole cost.
I found the recurring handoff and aligned the direction with research and engineering. I built browser and AI workflows from Bitwise’s chart rules.
Role
Product definition
Product design
Design-system documentation
AI-assisted implementation
Team
Research partners
Engineering consultation
I wrote Bitwise’s unwritten rules for spacing, typography, attribution, and formatting into a system the tool can apply.
Data sources
One workflow
The hard part was taking data in the form people already have it.
Upload data
Table editing, paste, CSV / TSV
For datasets the team already has.
Market pricing
Asset selection and daily date ranges
Live daily prices, with source attribution.
Bitwise Snowflake
Sample-data prototype
Explores a path to internal datasets.
Impact
In use
At least ten colleagues use Chart Studio in the browser or through a ChatGPT and Claude skill. They can respond to a social trend without sending the chart back to design. Shorter chart work on the Staking Report brought that report’s design time down as well.
Chart Studio exports
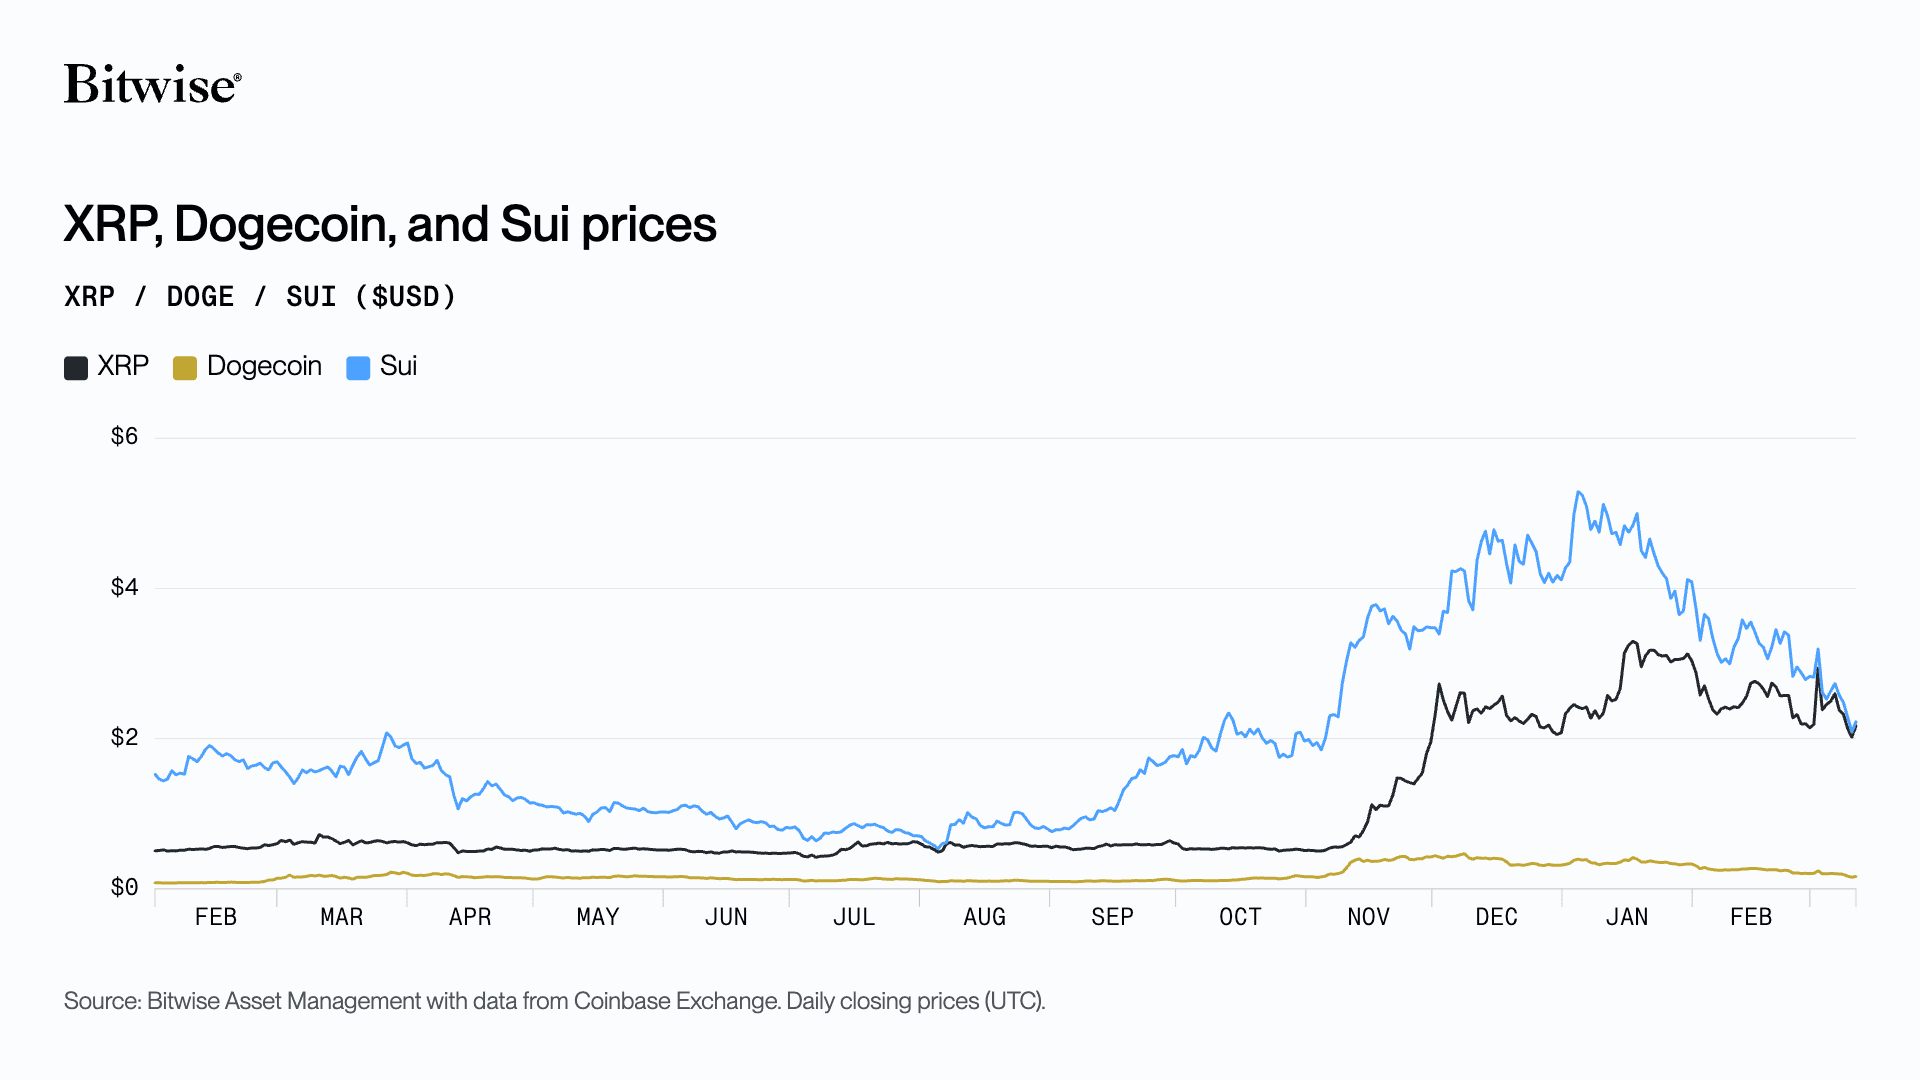
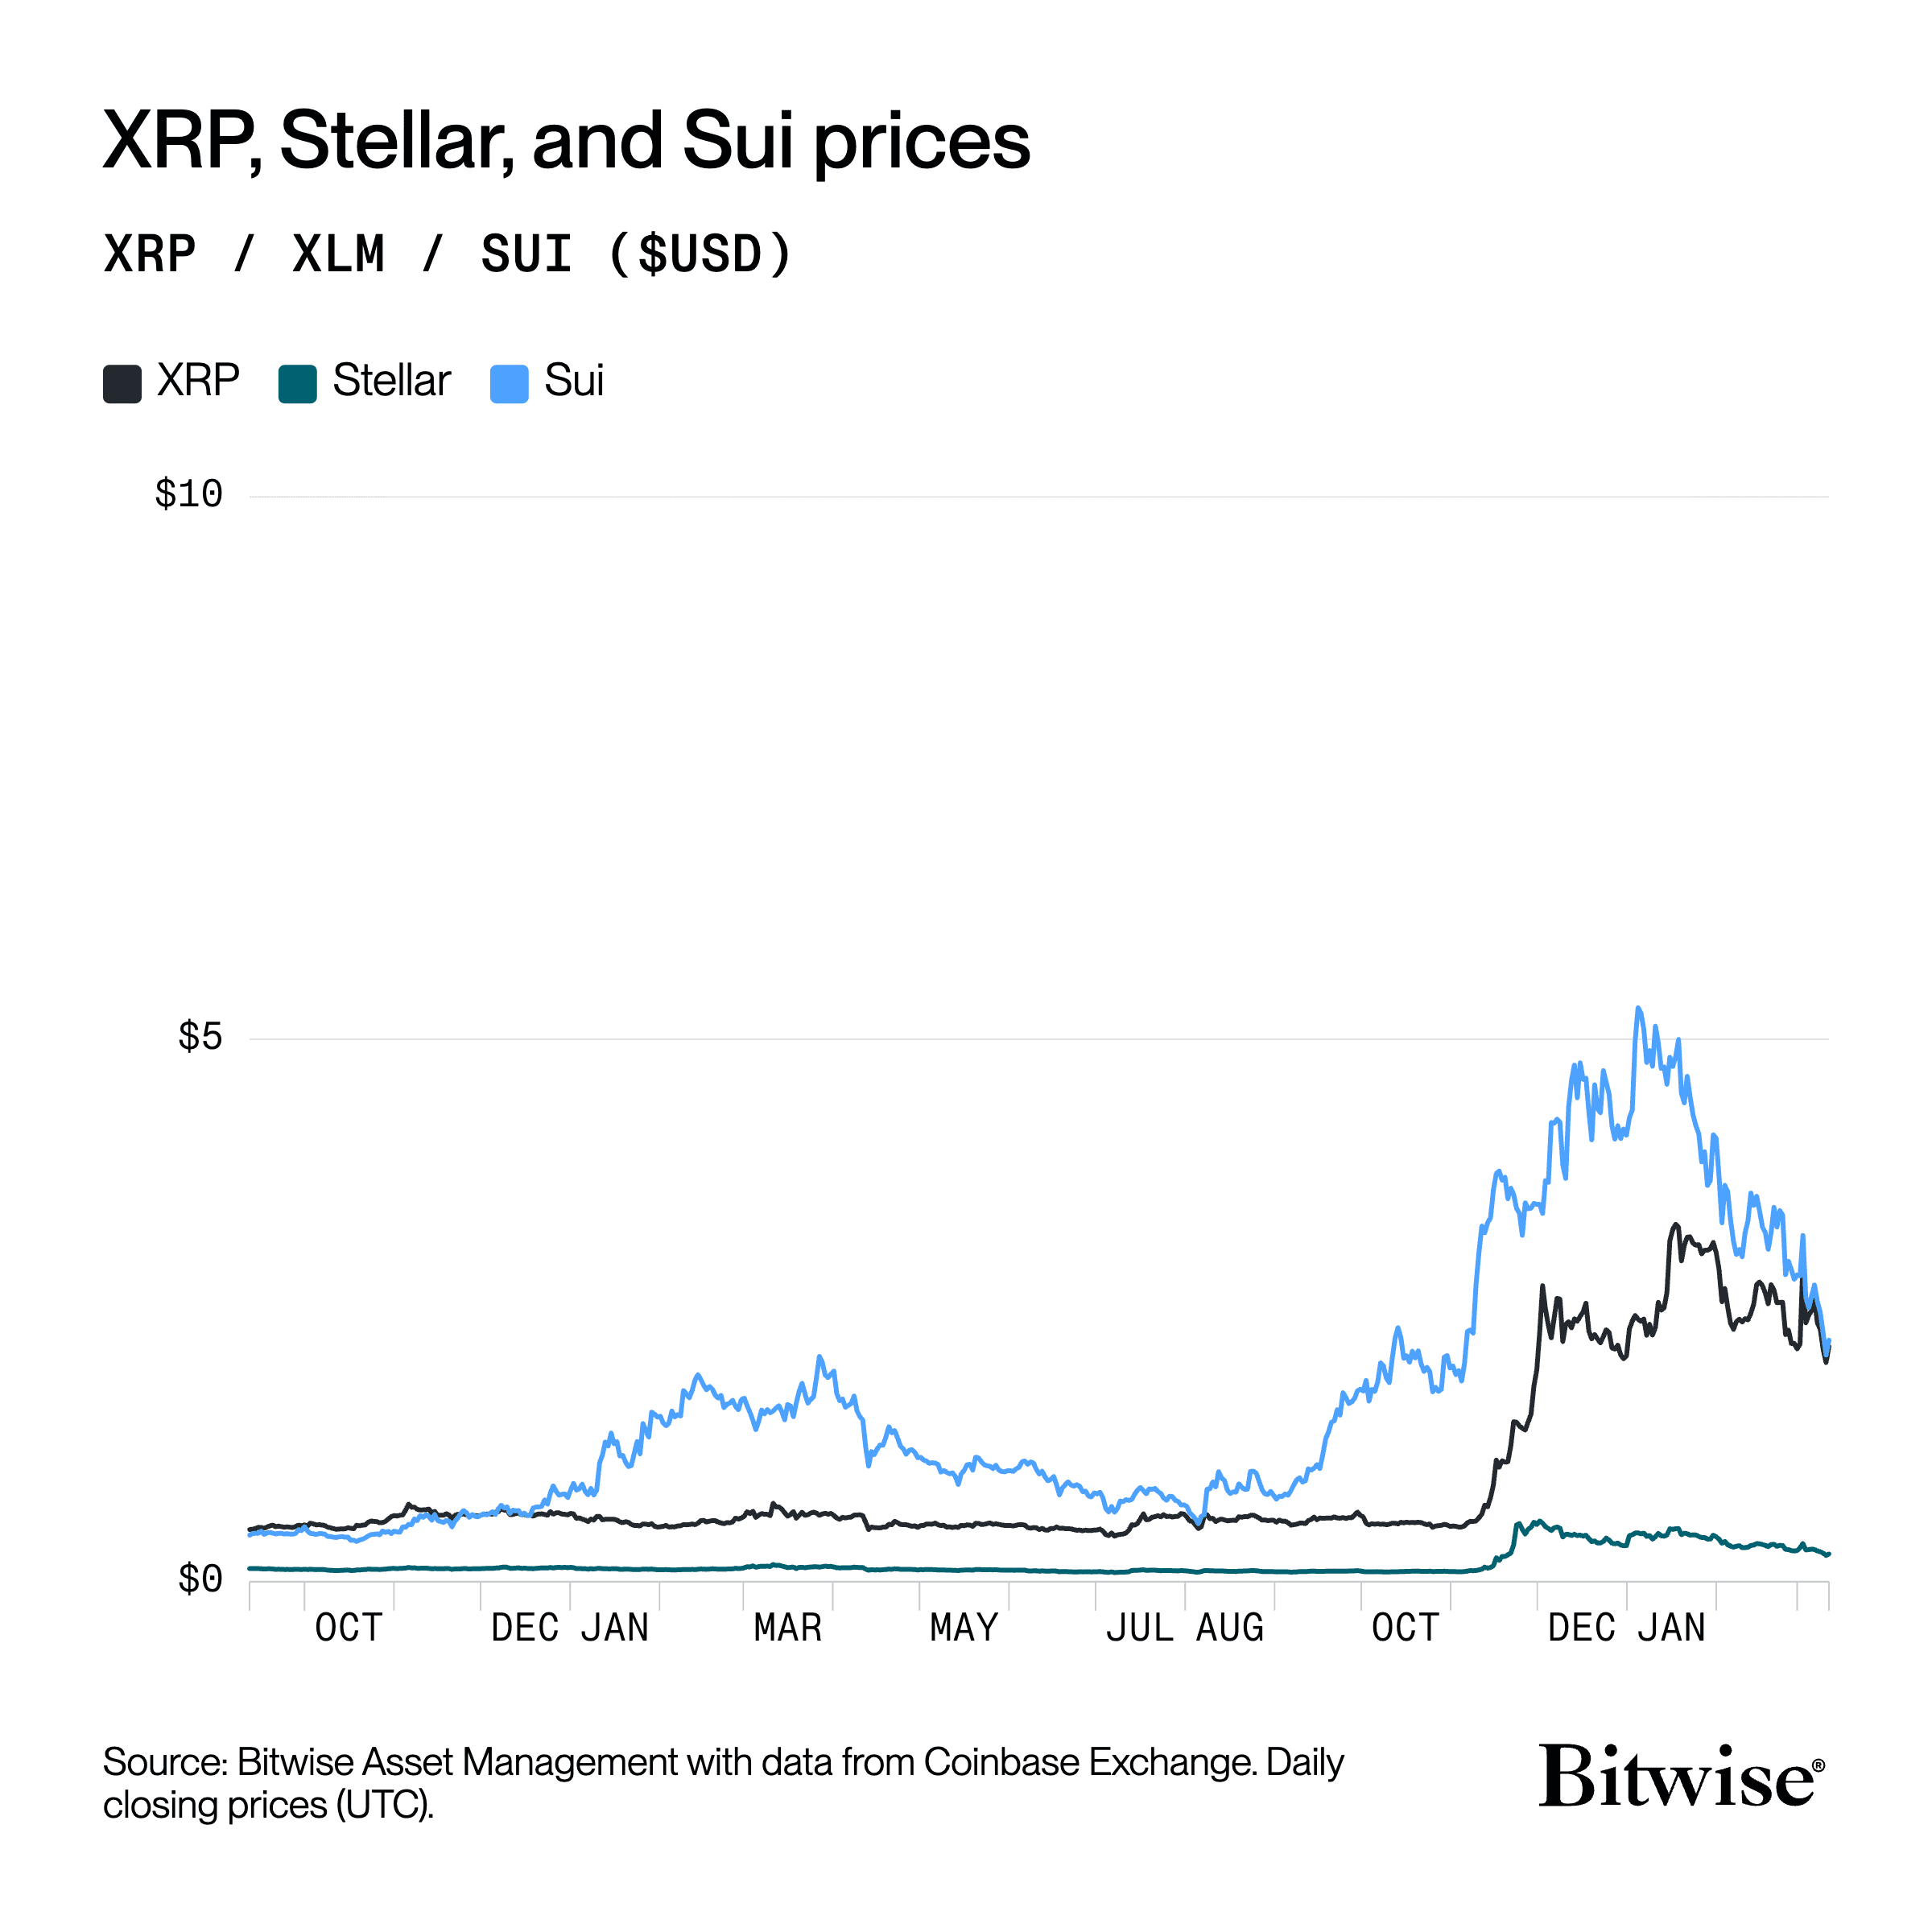
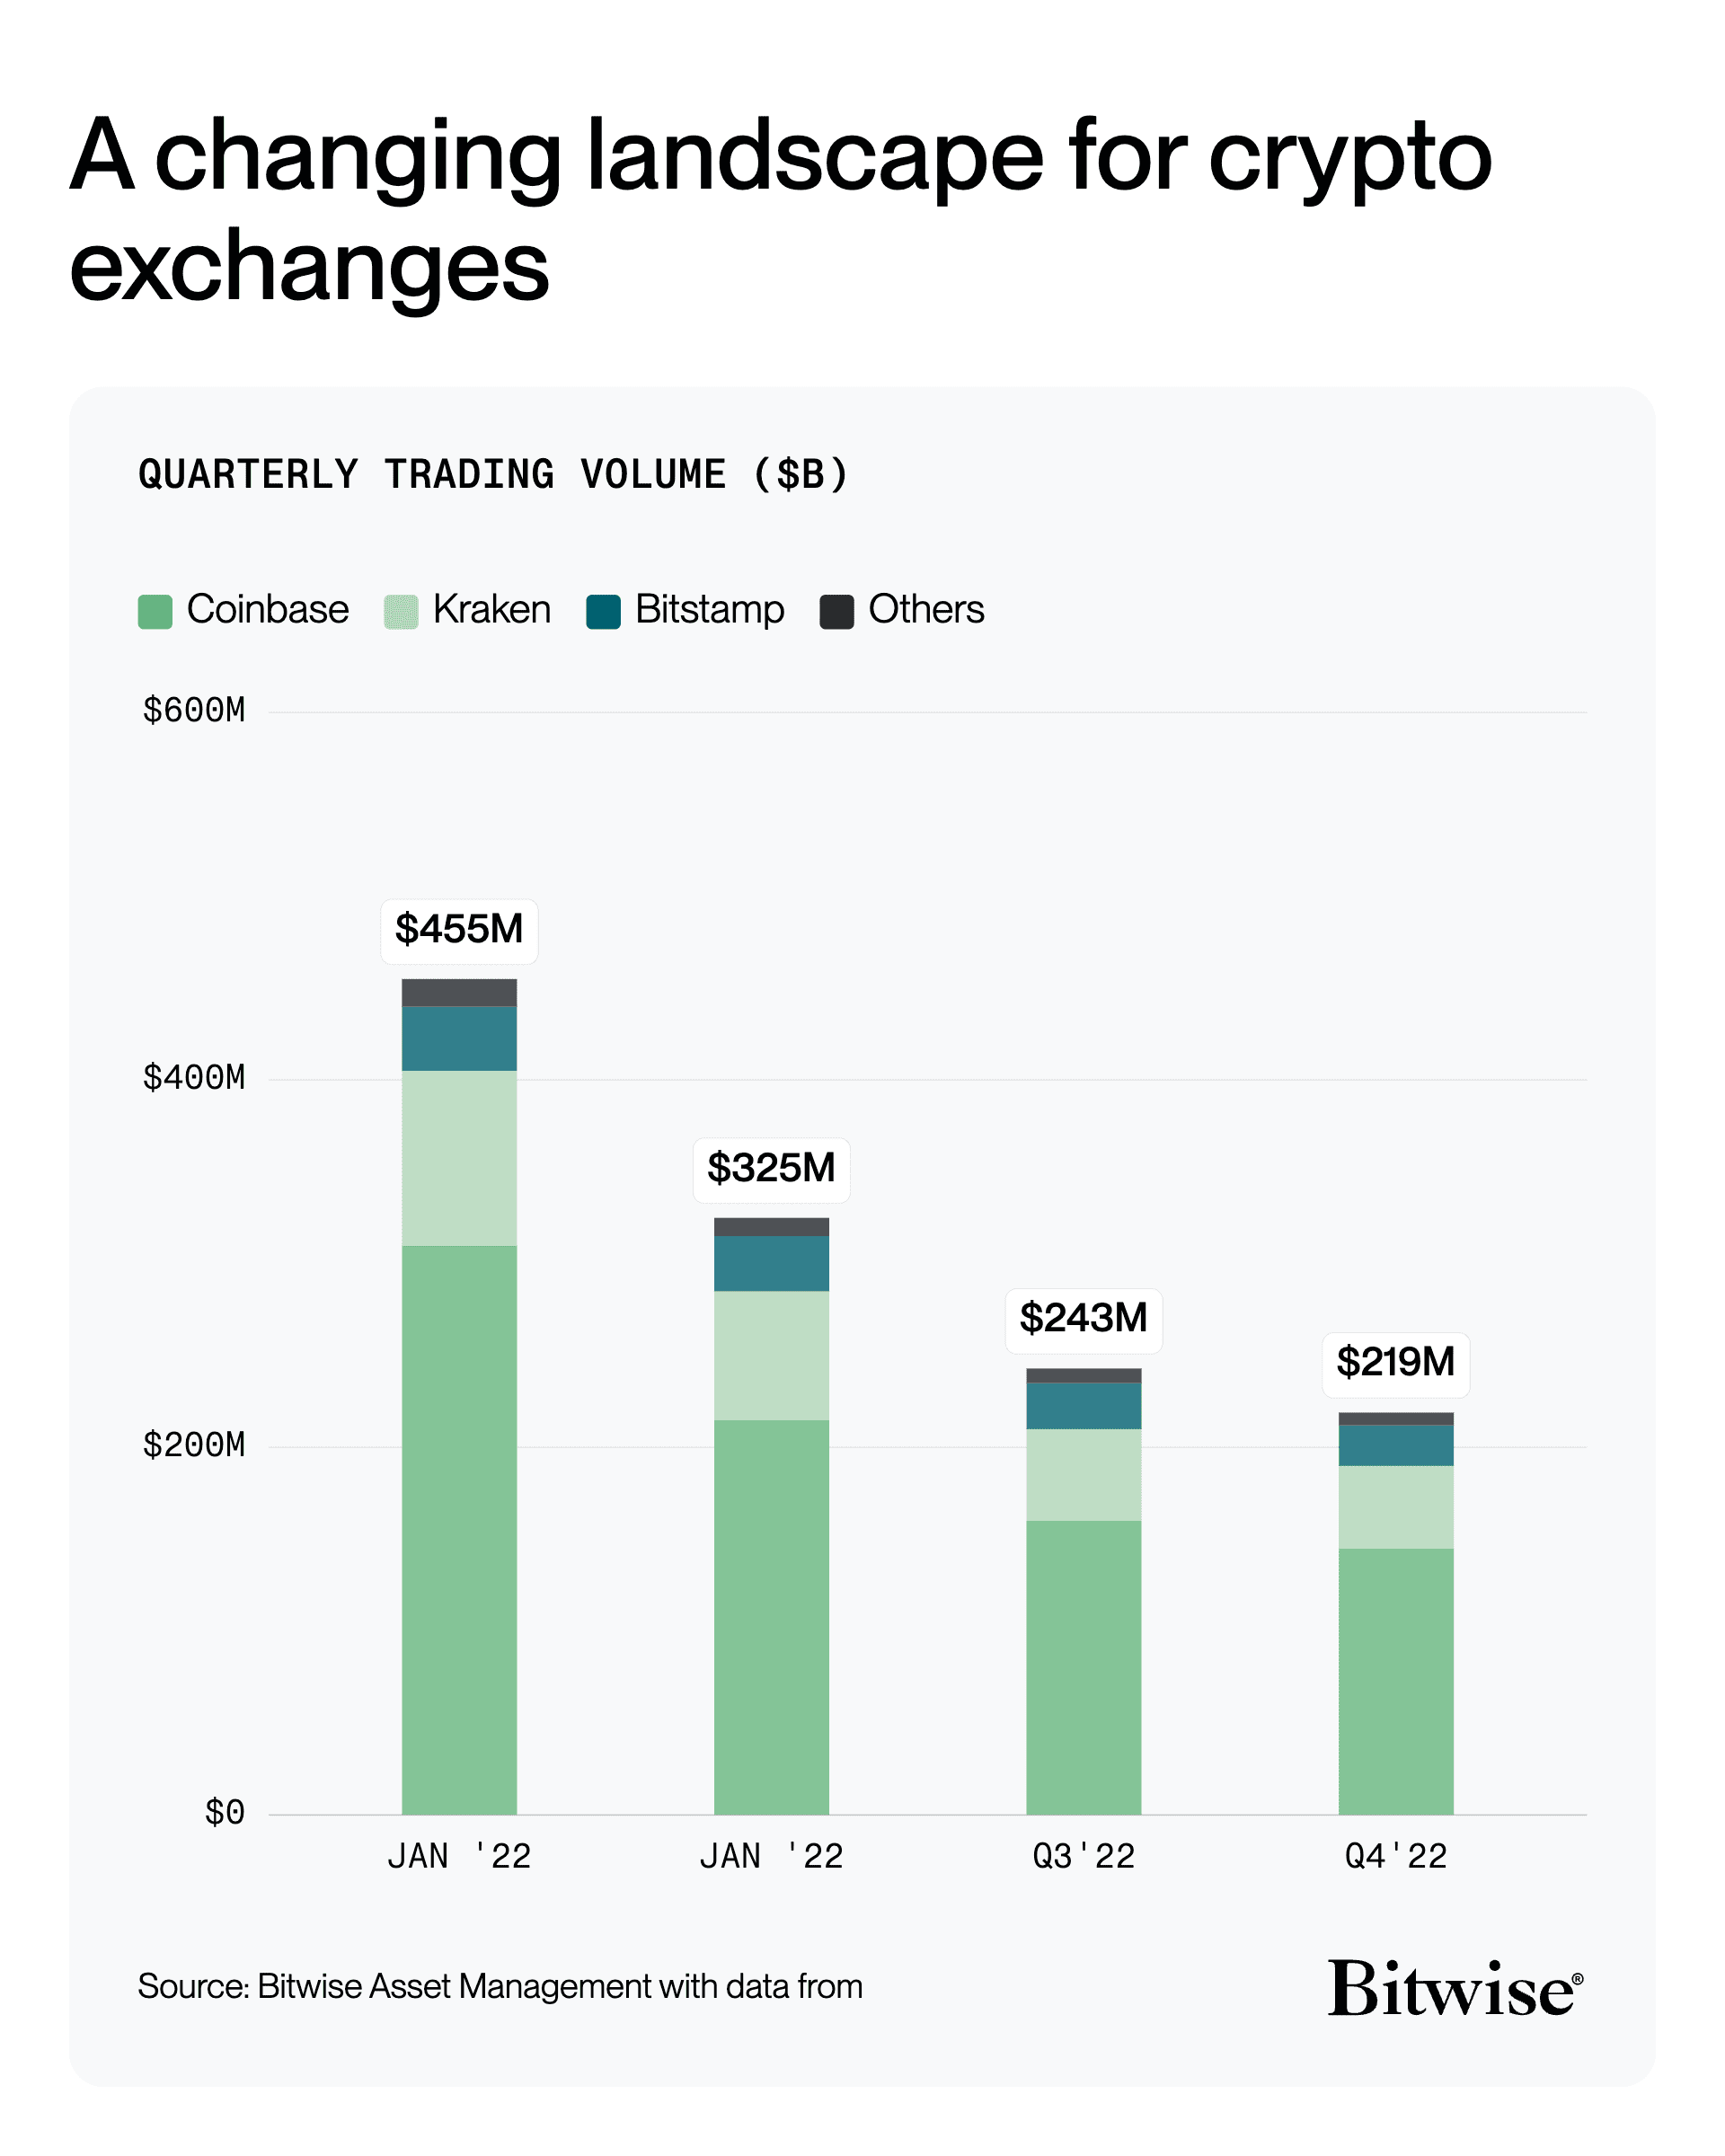
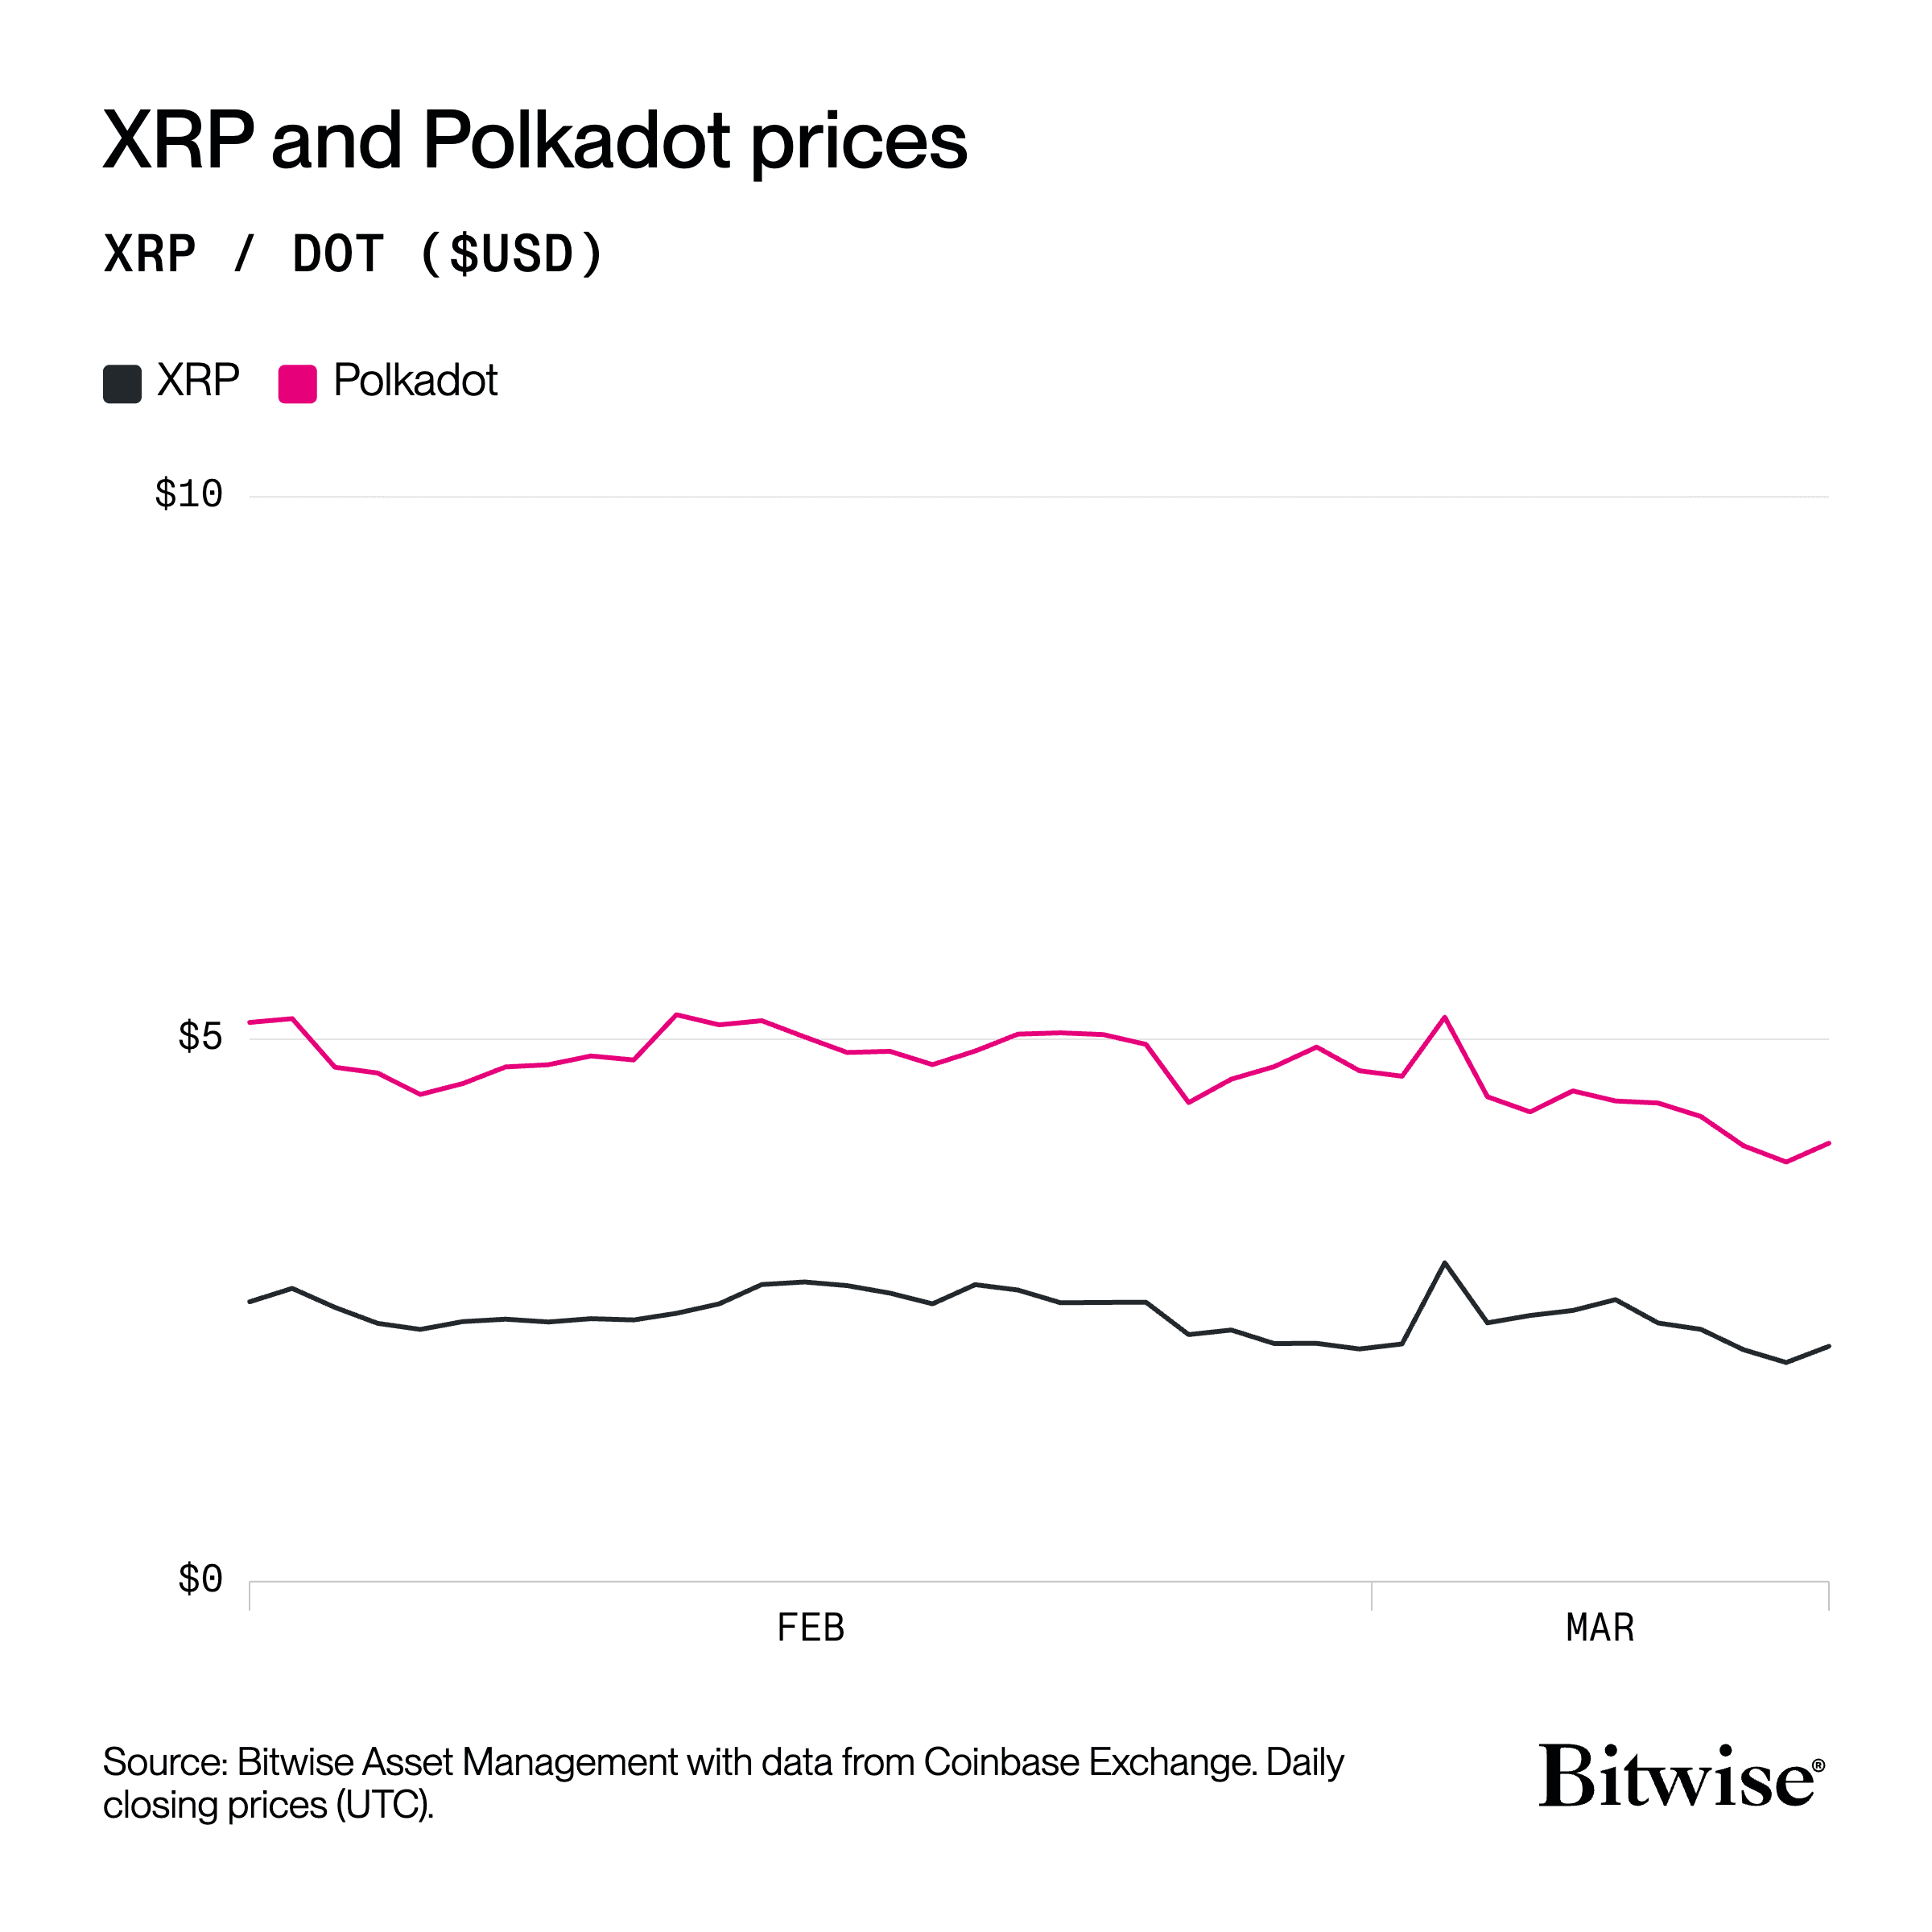
In situ
In the paper
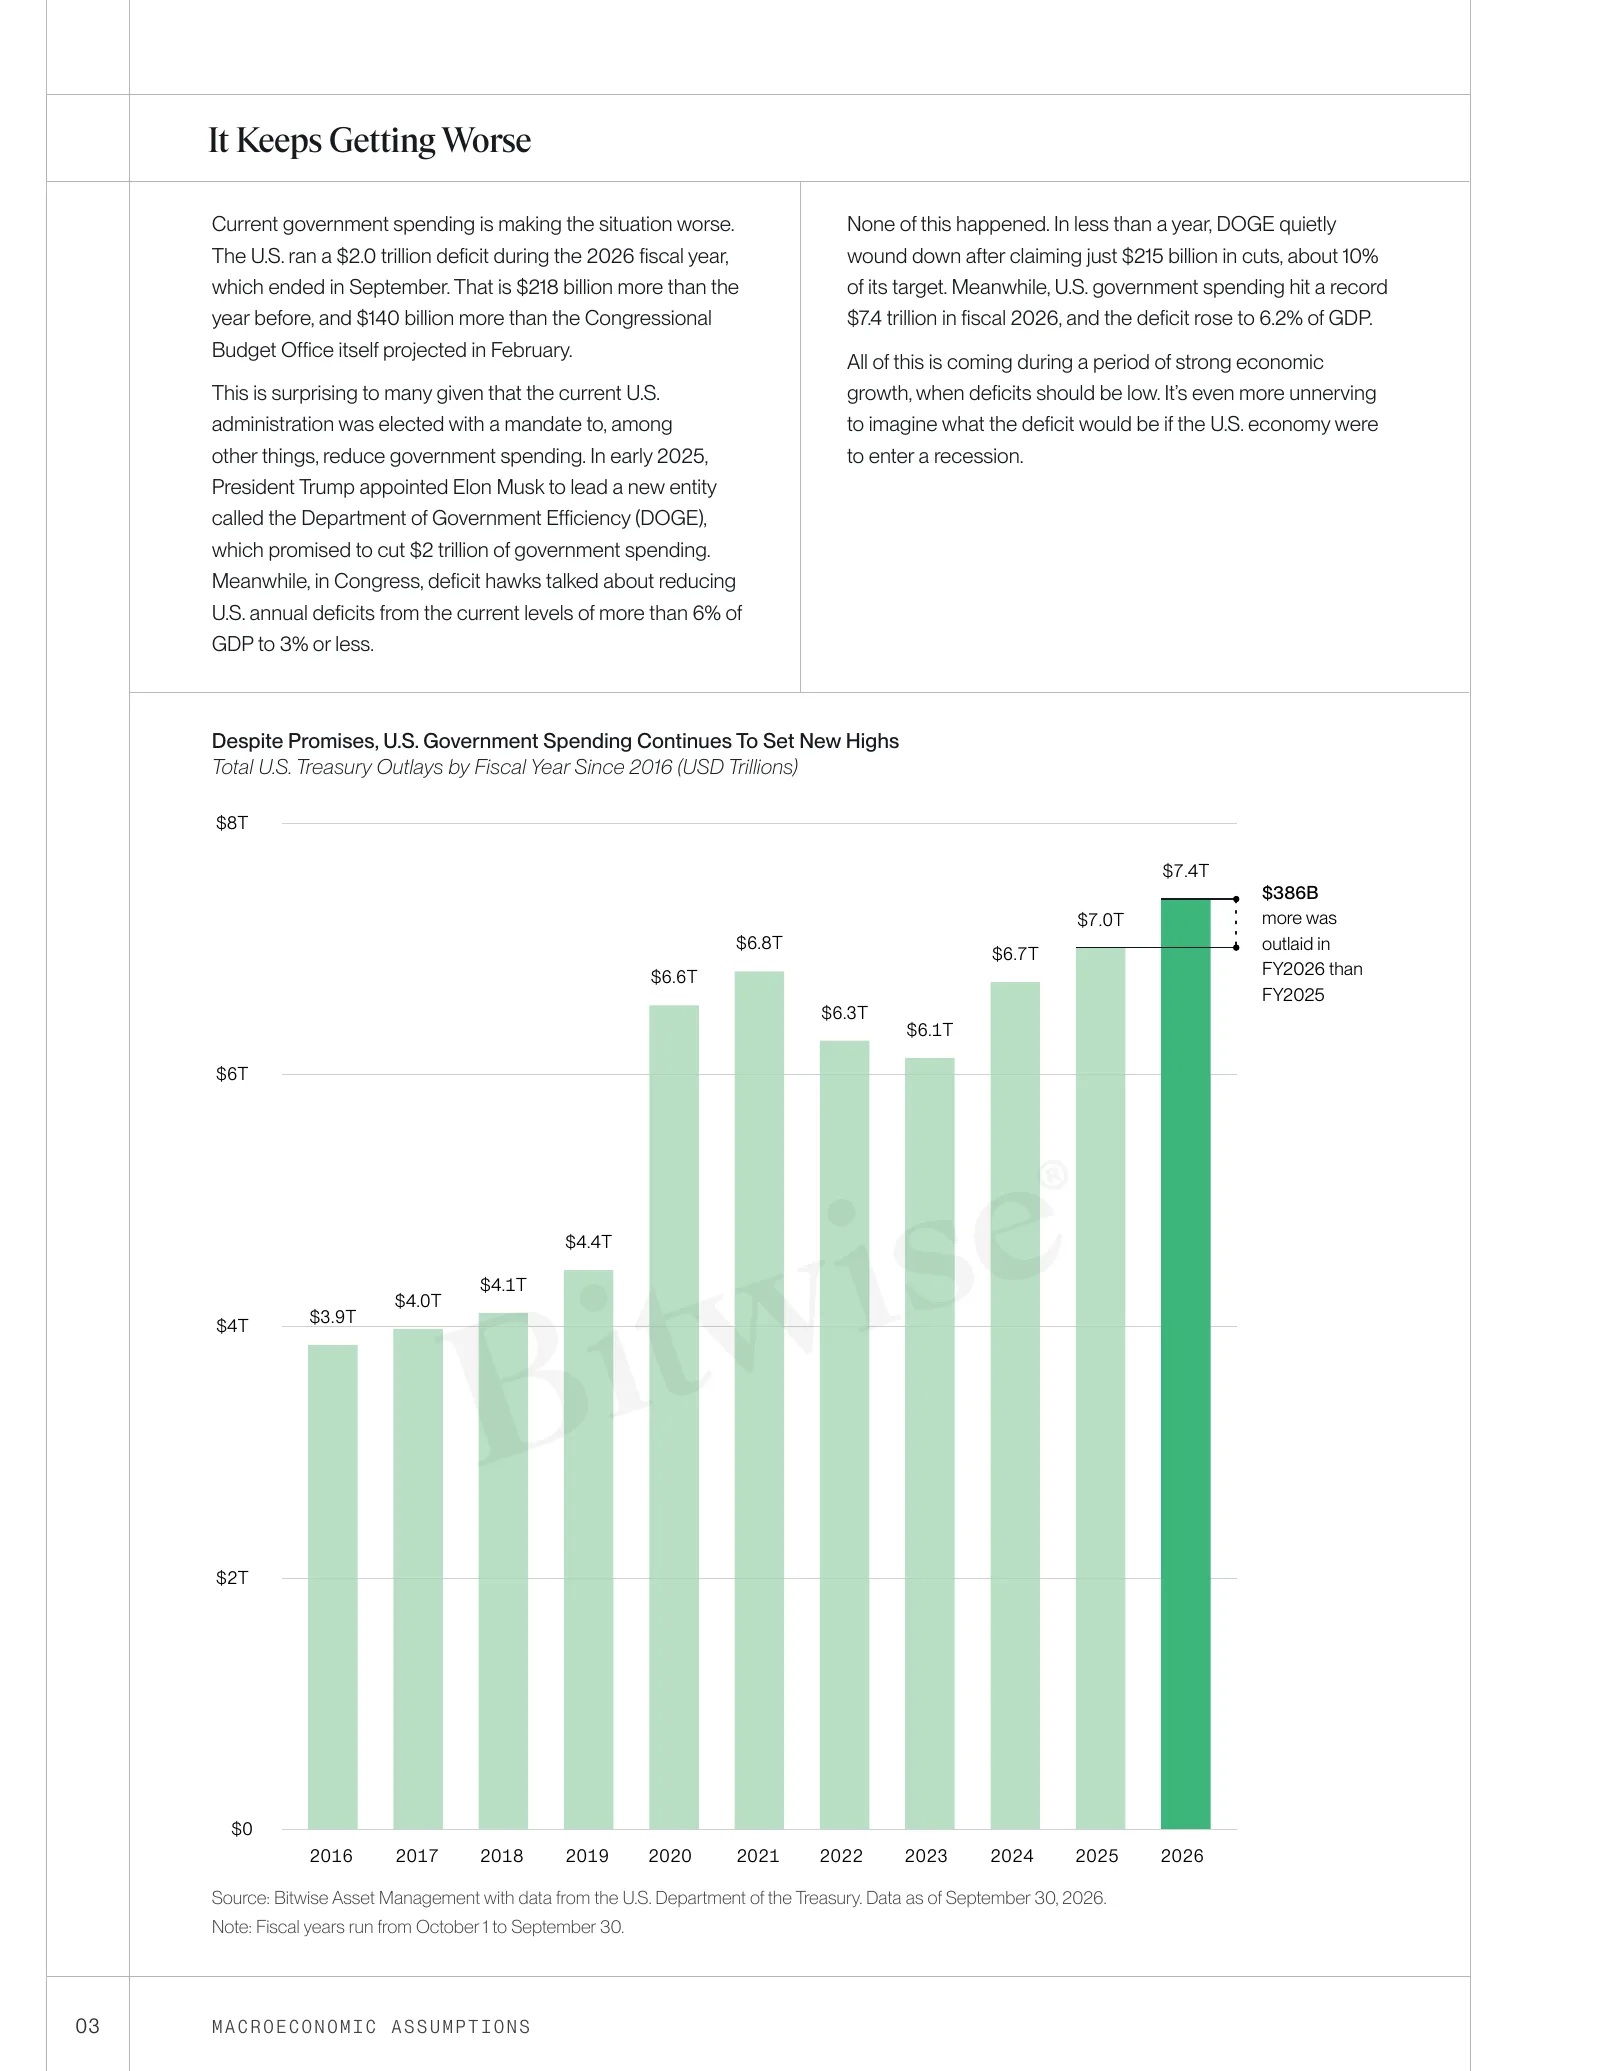
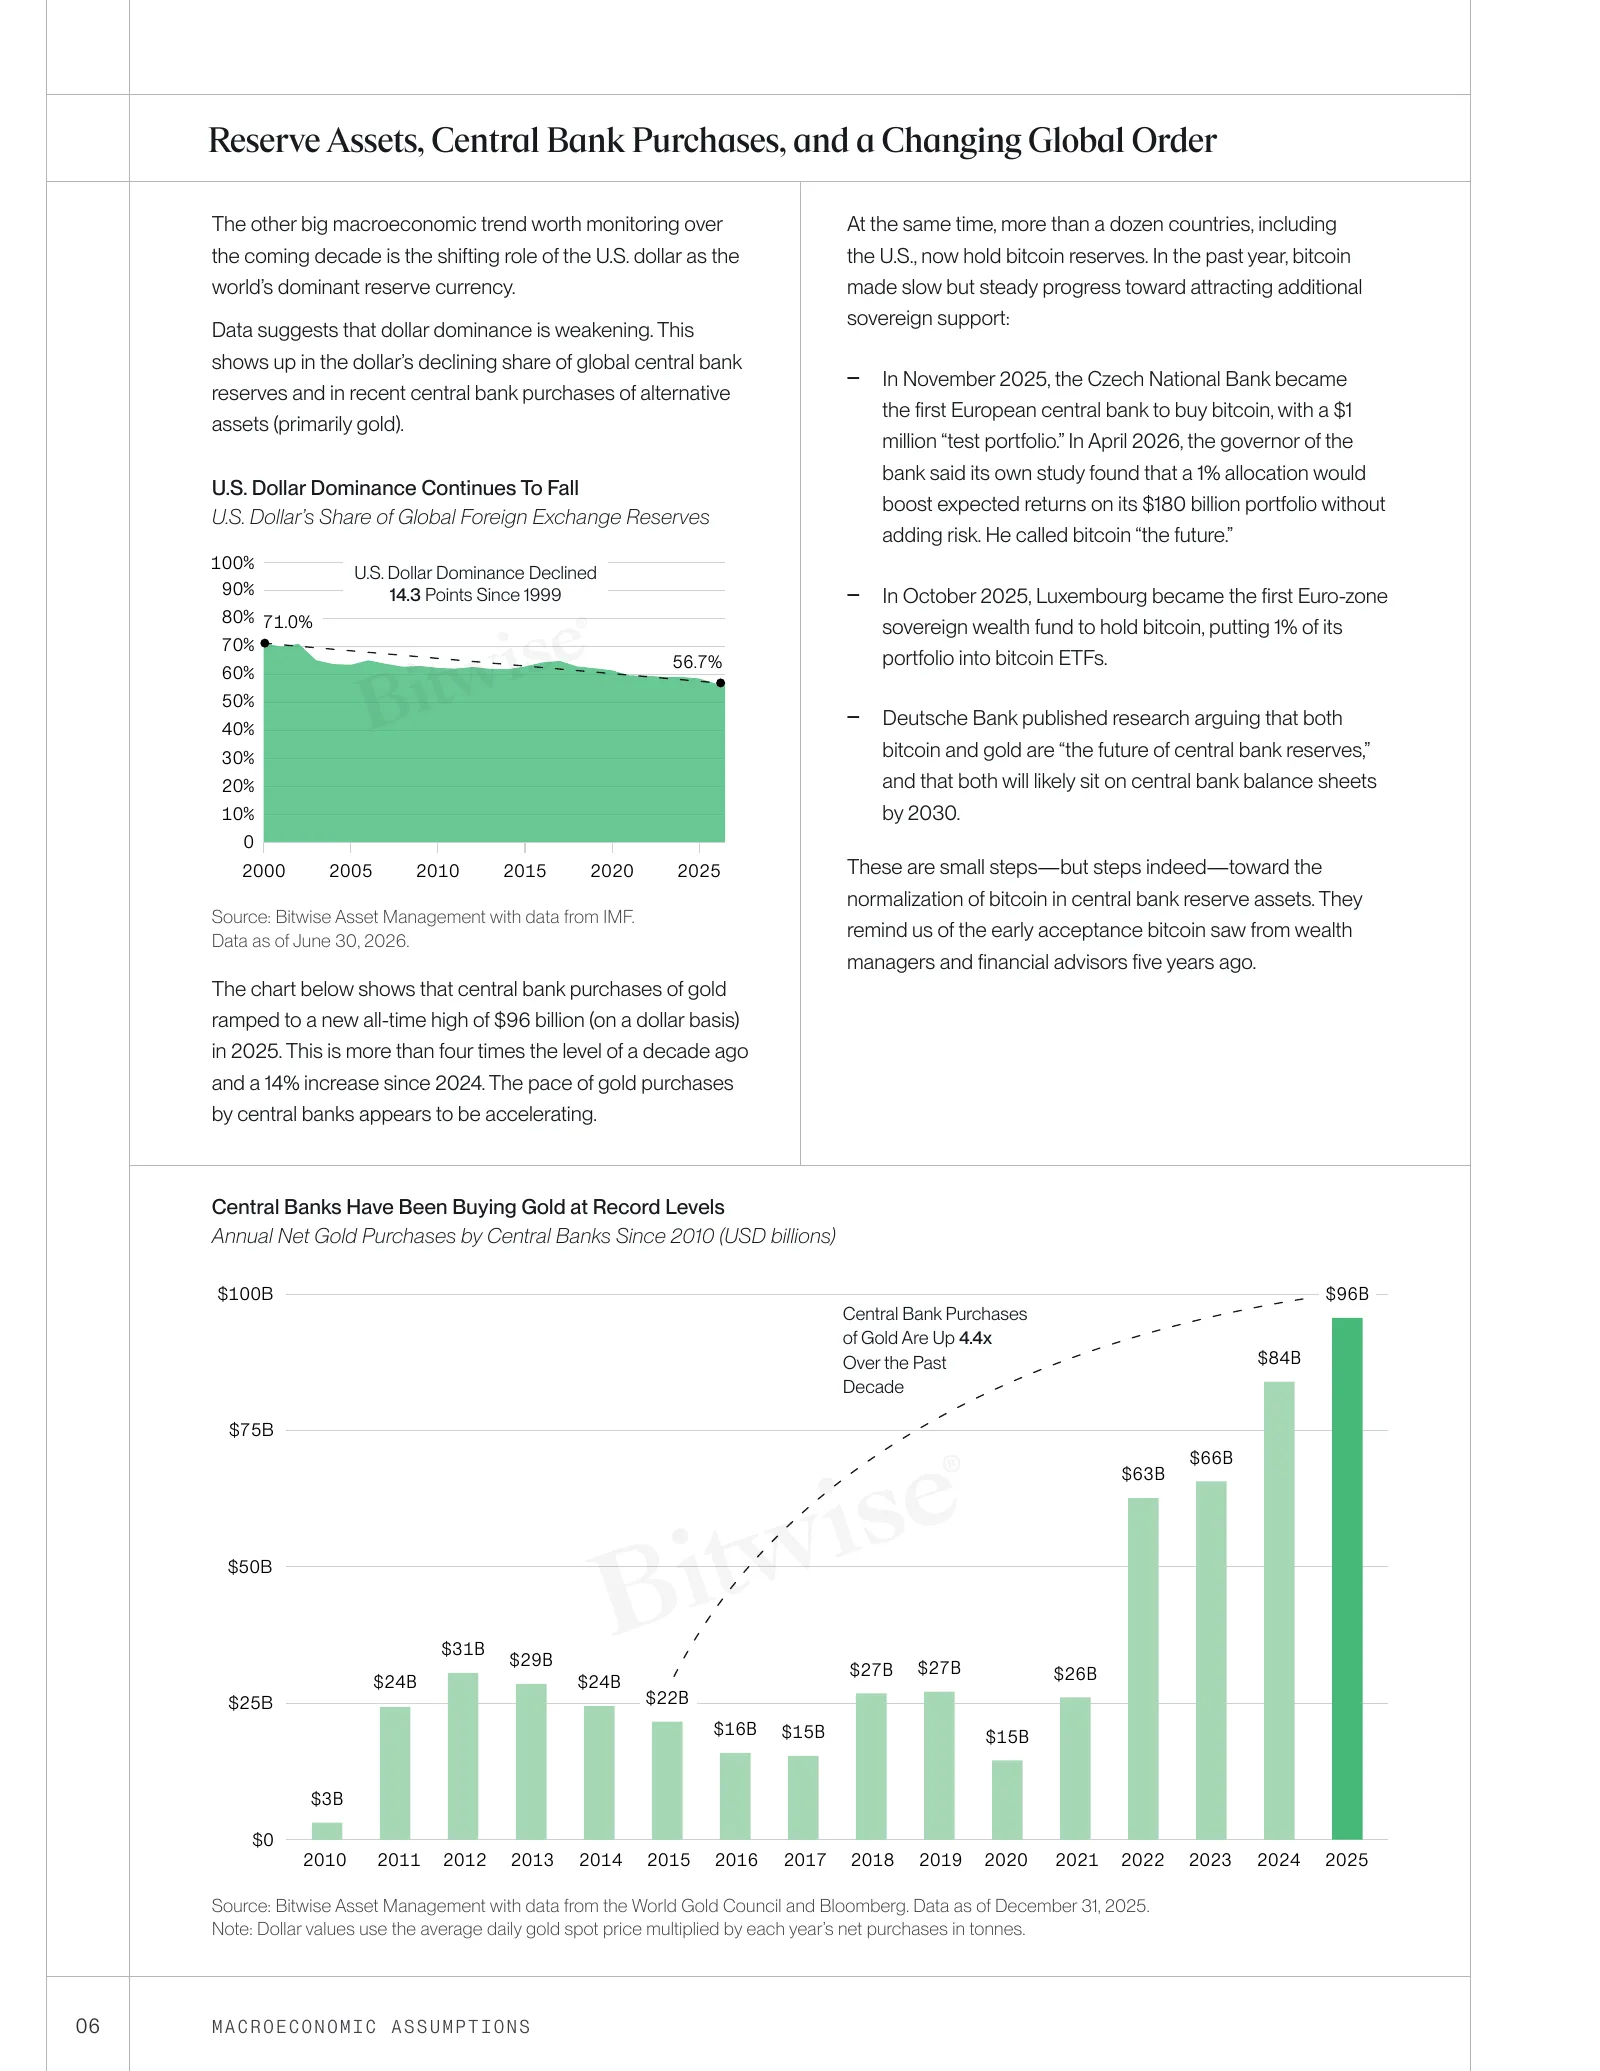
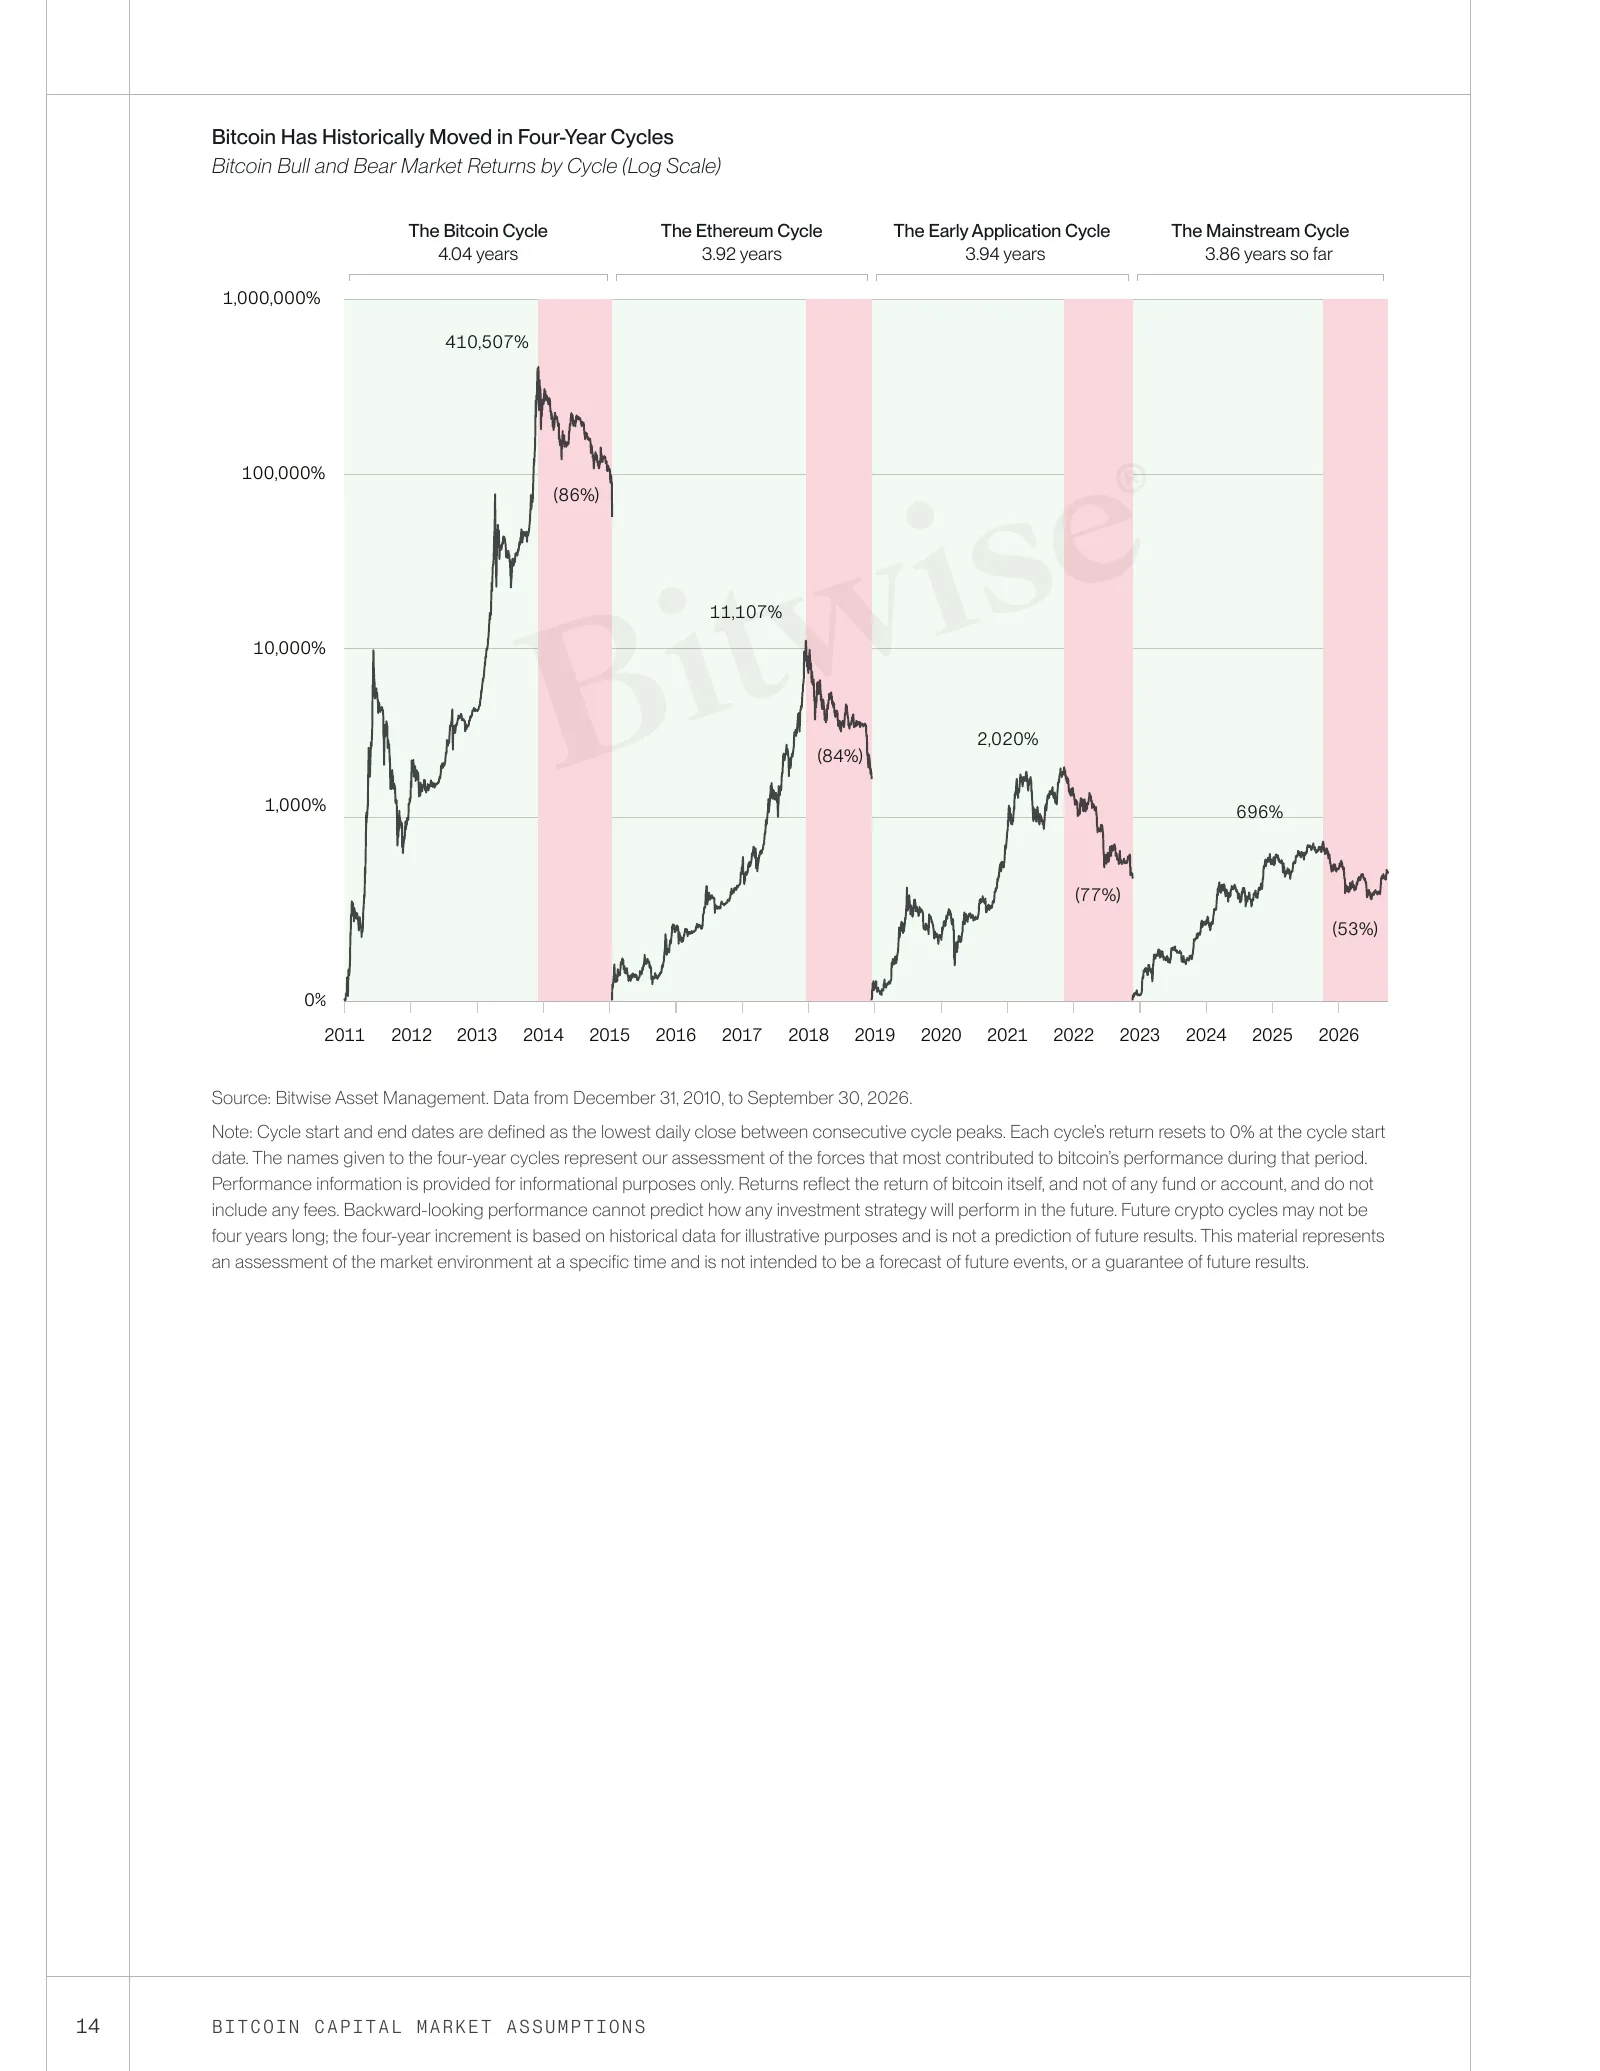
2027 Bitcoin Long-Term Capital Market Assumptions, charts made with Chart Studio.
Interactive demo
Make a chart
Use Bitcoin or Ethereum pricing, pick a format, and preview the motion. This public demo limits the data and brand controls. The internal tool supports more inputs and exports.
Chart Studio’s live chart animation uses Liveline.